2022 Airport Complaint Report

This report covers complaints from January through September 2022

Compared with the same period last year, the complaint rate per thousand operations was down significantly through July, but then saw a huge spike in August--due mainly to an on-line petition campaign sponsored by the Riviera Homeowners Association.

The complaint "hot spots" have changed from Zones 6,7,and 8 to zone 10 (out of the City). Most, if not all, of the Zone 10 complaints likely came from the south traffic pattern area.

Where do the complaints come from?

This graphic shows the source of complaints by reporting zone. The values for each zone are the percentage of total reports for the period.

Approximately 68% of the complaints through September 2022 came from the south traffic pattern area. Over 91% of the complaints from that area were about "loud" aircraft. However, the measurements by the new Casper monitoring system shows that, since that system began operation on 11 August, all but 4 aircraft flights in the south pattern area were within the 82db noise ordinance limit as measured on the Casper System monitors in that area.

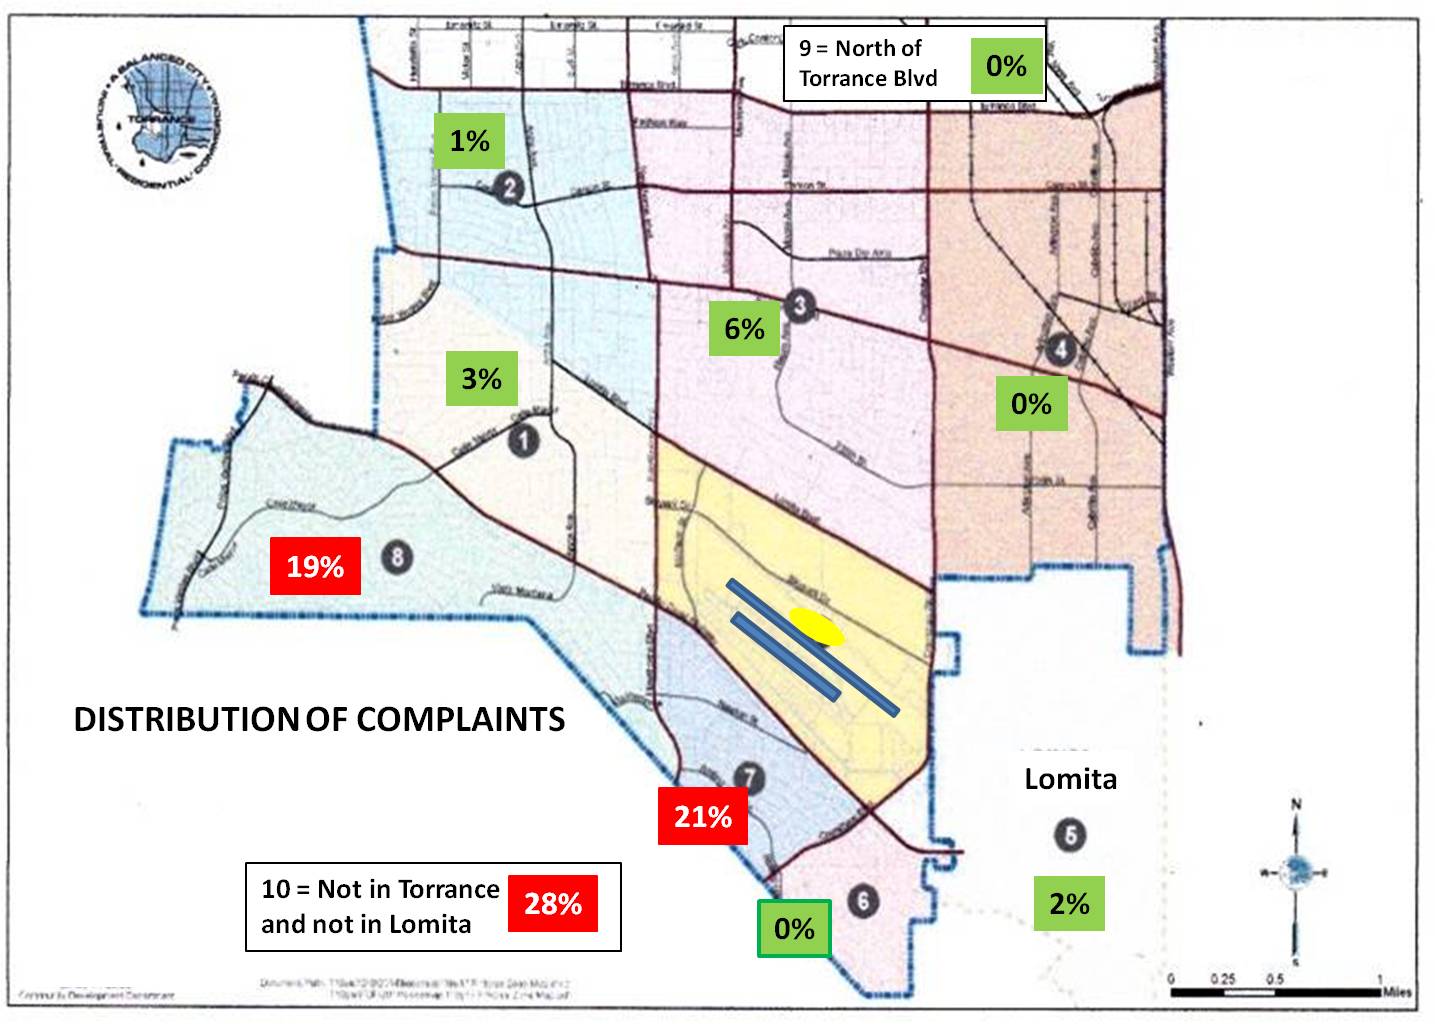
The Community Development Department has advised that it will no longer provide information from the Complaint logs--the source of these reports for the past two years--and will only use data from the new Casper monitoring system. Therefore, the map format shown above will no longer be available. Location information will be limited to "within Torrance city 
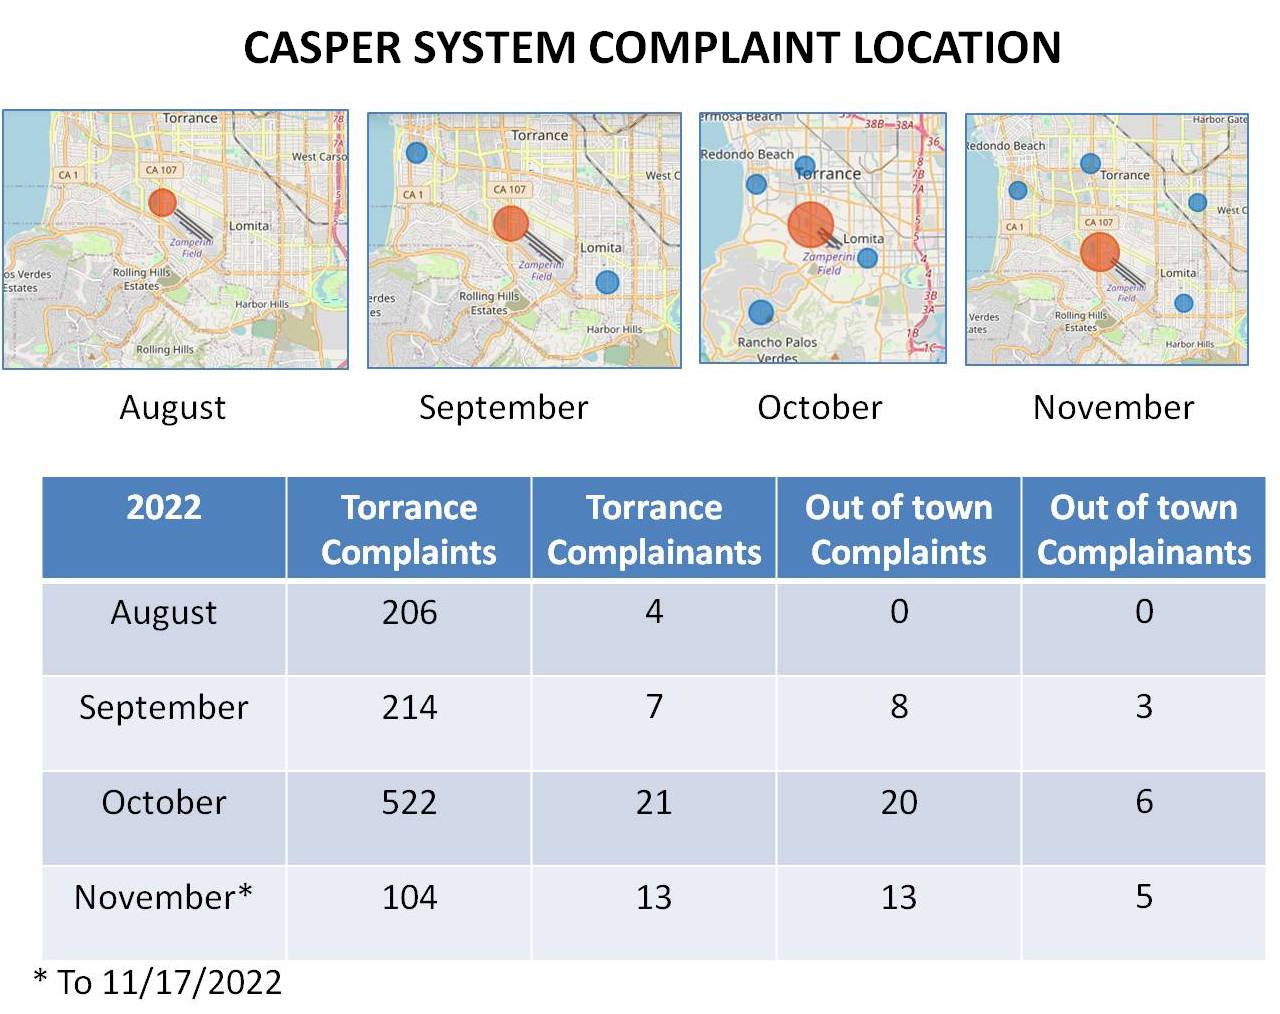
limits" and "outside Torrance City limits" as shown here.

On the "plus side," however, the Casper system provides another very valuable parameter which has been missing from the Department's reports: the number of complainants. This reveals that a few individuals each file a large number of complaints each month:

  • August average 51 each
  • September average 22 each
  • October average 20 each
  • November average 6 each

It is likely that the same individuals regularly submit complaints each month, meaning that the average number of complaints per individual is likely much higher if measured over a quarter or over a year. It would be useful to know (and the Department has the data to show) how many different individual complainants are active over a longer period.